Category Archives: Election Profiles

  • -
Esri online map on the Aspirational Left by current federal seats from March 3, 2023

Rise of the Aspirational Left voters reshaping Australia

Category:Demographics,Election Profiles

Here’s a snip of an ADS/ESRI online map showing dark red shading for the three federal seats of Brisbane, Griffith and Ryan. All three seats were won by the Greens from the Liberals or from Labor in 2022, despite big Two Party Preferred (2PP) swings and votes to the ALP.

https://arcg.is/0G4iL1

Esri online map on the Aspirational Left by current federal seats from March 3, 2023

These seats are coloured red because they’re among the top-rated seats in Australia for our new Aspirational Left Index prepared by Australian Development Strategies for our new 2021 Census modelling database.

Unfortunately for the ALP Candidates in these three seats, the Coalition was so on the nose with the Aspirational Left in 2022, that the three Coalition candidates each lost more than 10 percent of their 2019 primary vote.

This ten percent loss from the Coalition leaked strongly to local hard-working Green candidates, rather than to Labor, putting the Greens ahead of Labor in the final distribution of preferences, with four out five Labor voters then tipping out the leading Coalition candidate and electing the Green.

This story played out across the nation in 2022, with 20 seats changing hands. The Coalition lost 18 seats, ten to the Labor Party, six to Teal Independents and Ryan and Brisbane to the Greens. Labor lost Griffith to the Greens and Fowler to an Independent.

Of these 20 seats changing hands in 2022, 14 of them are among the list of our top seats on the Aspirational Left Index. In other words, Aspirational Left voters decided which party won Government in 2022 and which MPs dominated the cross benches.


Radio National Podcast on Aspirational Left role in elections, from March 3, 2023:

Could a new demographic tip the NSW state election? – ABC Radio National

Could a new demographic tip the NSW state election? (Image Unsplash: Daria Nepriakhina)

Could a new demographic tip the NSW state election? (Unsplash: Daria Nepriakhina)

Australian Financial Review Aspirational Left feature article, from March 2, 2023 for AFR subscribers:

https://www.afr.com/politics/federal/the-rise-of-the-aspirational-left-voter-who-is-remaking-politics-20230224-p5cndx


BACKGROUND TO THE RESEARCH

When the Australian Electoral Commission provided the final Two Party Preferred votes and swings from the May election in the second half of 2022, we were able to use the 2021 Census results to re-calculate our 2022 election profiles and all our Stereotypes and models of unemployment, participation rates, wealth, taxable incomes, sources of income, transfer payments, school enrolments and school fees.

We then began using the new census when our Education Geographics (EGS) arm profiled enrolment churn across more than 120 Australian non-government schools and our Health Geographics (HGS) arm profiled an unexplained surge in numbers of Australians taking out private health insurance.

Across these three areas of research by ADS/EGS/HGS we began seeing the influence on voting, choice of education sector and increase of private health insurance by a new aspirational and transactional demographic group we named the Aspirational Left.

Big components of the Aspirational Left include Professional Women and Asian Migrants. Professional women are now the fastest growing occupational group among Australian workers and Migrants now make up more than 50 percent of Australian Population increases since 2001.

These groups are therefore likely to increase in numbers and influence in Australia in the coming decade and exert a strong and growing influence over future state and federal elections and the uptake of private education and private health insurance.

At ADS/EGS and HGS we will be including this new group in all our future modelling.


  • -
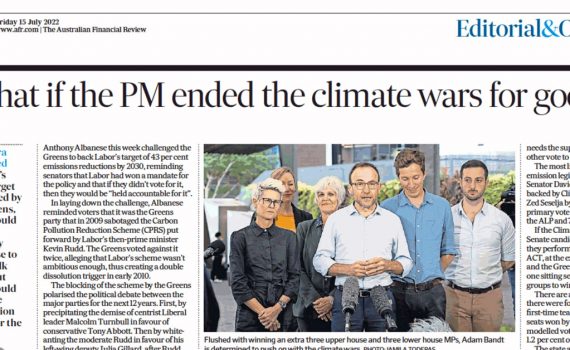
What if the PM ended the climate wars for good?

What if the PM ended the climate wars for good?

Category:Election Profiles

If Labor’s 2030 carbon emissions target is blocked by the Greens in the Senate, most Canberra Observers would expect Anthony Albanese to crab walk away. But what could happen in a double dissolution if he called their bluff, to end the Climate Wars started by the Greens in 2009?

🔗  Read More…

📷AFR


  • -
2022 Federal Election Swing Map

2022 Federal Election Swing Map

Category:Election Profiles,MAY 21 ELECTION COMMENTS

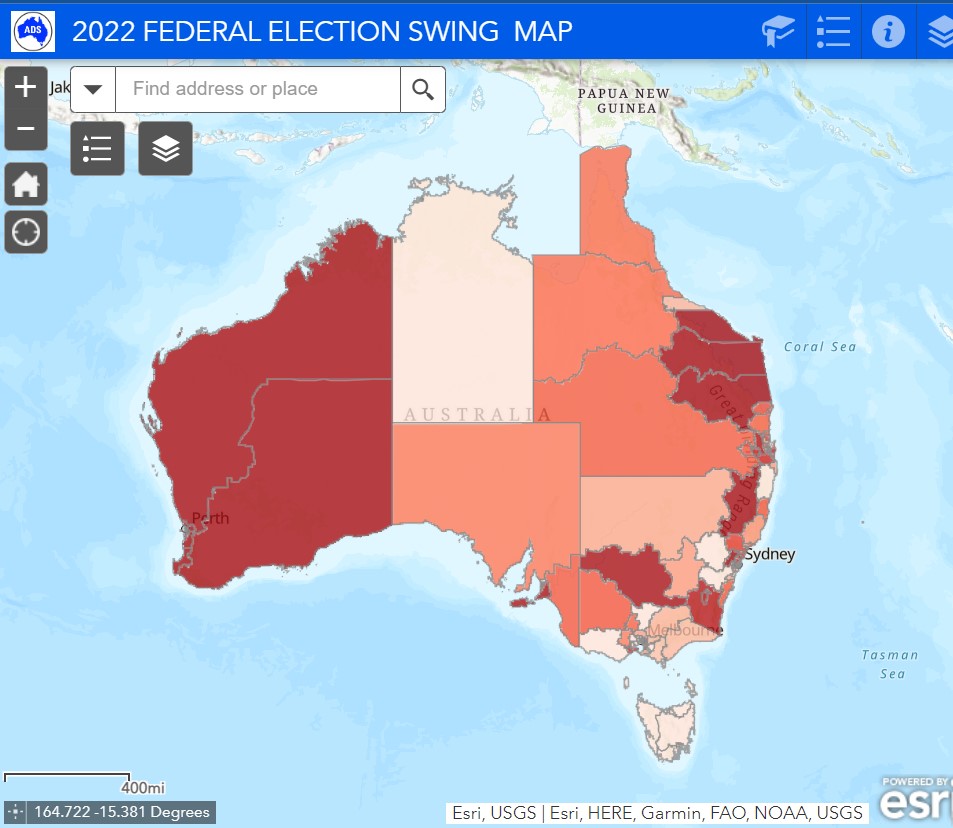
The big winners and losers in the 2022 Election can be seen in our online interactive ADS 2022 Election Map.

The five big players in 2022 were the traditional majors: the ALP and the Coalition, but also the minor parties, like the Greens, the Teals and the Others (including One Nation and the UAP).

The influence of the minor parties in 2022 was wielded not so much through their preferences, but through the sheer size of their primary votes, as the support base for the major parties shrunk, with the ALP going backwards in some of its once-safest seats in Victoria to One Nation, the UAP and the Teals and the Liberal Party copping an absolute hiding in its wealthiest seats to Independents and in its former stronghold of Western Australia.  

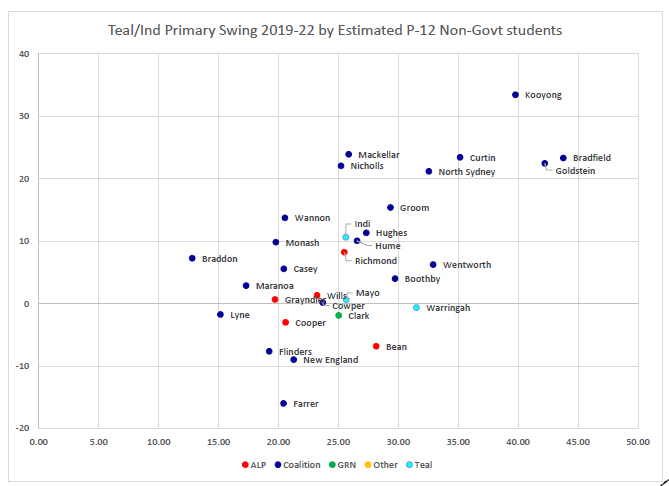
Teal campaigns run by the Climate 200 group wiped out the Green primary vote when they both ran in safe Liberal like Kooyong, but where there was no Teal candidate, as we saw in three Brisbane River seats won by the Greens, the Liberal primary vote losses switched directly to the Greens.

The primary vote for the Others group exceeded 20 percent after ten percent plus swings to the minor parties in normally-solid Labor seats across Victoria, NSW and Tasmania.

While the Liberal Party has a problem in its safest seats with the higher-income Teals, the ALP has a problem in its safest, lower-income seats, with right wing minor parties.

The interactive Esri map also shows an innovative cube layer for two of the key demographic drivers for the Teal vote: Female Professionals and Top Quartile income earners, so you can see how these two variables interact.

See story in  The Australian Financial Review 

Click to view interactive ADS 2022 Election Map

2022 Federal Election Swing Map


  • -
2022 Federal Election Top Income Quartile Map

2022 Federal Election Top Income Quartile Map

Category:Election Profiles,MAY 21 ELECTION COMMENTSTags : 

If you want to know which federal seats are most likely to swing strongly to the Teal candidates at the Federal election on May 21, check out the 🔗Map below.

2022 Federal Election Top Income Quartile Map

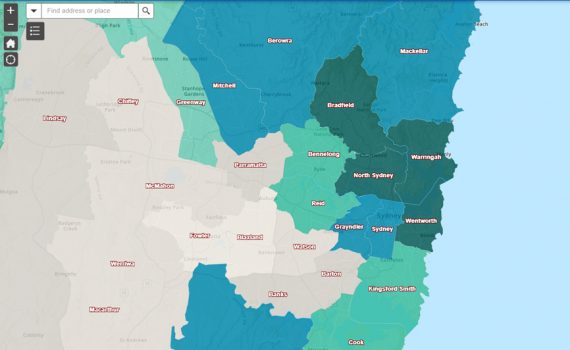
The map shows  the percentage of top income quartile persons in 2022 Federal seats in darker shades of teal and is modelled by ADS from the latest available Australian Tax Office data.

Demographic break downs of national Newspoll summaries published in The Australian between early 2020 and the start of the 2022 election campaign, indicate that about one in eight voters in this top income quartile had swung their previously strong support in primary vote terms from the Coalition, directly across to Voices or “Teal” candidates, where a Teal candidate was available.

To put this in perspective, in early 2020, nearly half of all voters in this income group cast their vote for Coalition candidates and in the first quarter of 2022, this figure was down to one in three.

While this may well be the national sentiment among top income earners, where no Teal candidate is available at this election, there is still likely to be a smaller Two Party Preferred swing from the Coalition to Labor from about one in 12 voters among this group.  This disaffection from top income workers represents serious hurt for Liberal MPs in what have been their traditional strongholds.

We’ve been looking at the demographic breakdowns by income in individual seat polls and nothing we’ve seen so far contradicts the above trend up to the second week of the campaign.

Nonetheless, we will be watching future Newspoll summaries, presuming another one is available before the election.


  • -
Australia votes on Saturday 21, 2022 and commented by John Black, former Labor Senator and Chief Executive of Australian Development Strategies

Federal Election Profiles 2022

Category:Election Profiles,National 2022Tags : 

Monday 20th June, 2022
Party Machines Conking Out
by John Black – AFR – Editorial and Opinion

Party Machines Conking Out

 To Read click link
🔗 Financial Review, Monday, June 20, 2022, pages from 36 to 37 -1.pdf

2022 Federal Election Swing Map

The big winners and losers in the 2022 Election can be seen in our online interactive ADS 2022 Election Map.

The five big players in 2022 were the traditional majors: the ALP and the Coalition, but also the minor parties, like the Greens, the Teals and the Others (including One Nation and the UAP).

The influence of the minor parties in 2022 was wielded not so much through their preferences, but through the sheer size of their primary votes, as the support base for the major parties shrunk, with the ALP going backwards in some of its once-safest seats in Victoria to One Nation, the UAP and the Teals and the Liberal Party copping an absolute hiding in its wealthiest seats to Independents and in its former stronghold of Western Australia.  

Teal campaigns run by the Climate 200 group wiped out the Green primary vote when they both ran in safe Liberal like Kooyong, but where there was no Teal candidate, as we saw in three Brisbane River seats won by the Greens, the Liberal primary vote losses switched directly to the Greens.

The primary vote for the Others group exceeded 20 percent after ten percent plus swings to the minor parties in normally-solid Labor seats across Victoria, NSW and Tasmania.

While the Liberal Party has a problem in its safest seats with the higher-income Teals, the ALP has a problem in its safest, lower-income seats, with right wing minor parties.

The interactive Esri map also shows an innovative cube layer for two of the key demographic drivers for the Teal vote: Female Professionals and Top Quartile income earners, so you can see how these two variables interact.

See story in  The Australian Financial Review 

Click to view interactive ADS 2022 Election Map

2022 Federal Election Swing Map


2022 Election Results – Summary for EGS Clients
Friday 27th May, 2022
by  EGS Founder John Black

Did a short presentation with Saul Eslake today on the 2022 election results and the implications for Education Geographics Client Schools, with particular relevance to the election of new Teal MPs. It makes interesting reading.

🔗 https://www.educationgeographics.net.au/pdf/Presentation 27 May 2022.pdf

2022 Election Results - Summary for EGS Clients from EGS Founder John Black

Election Profiles 2022

Monday 23rd May, 2022
🎙
John Black: Election earthquake signals death of major parties
episode from ABC “RN Breakfast” with Patricia Karvelas

To Listen click link
🔗https://www.abc.net.au/radionational/programs/breakfast/election-earthquake-signals-death-of-major-parties/13893828

Guest: John Black, former Labor Senator and Chief Executive of Australian Development Strategies

Image: ABC  RN : https://www.abc.net.au/radionational/programs/breakfast/


Election Profiles 2022

Monday 23rd May, 2022
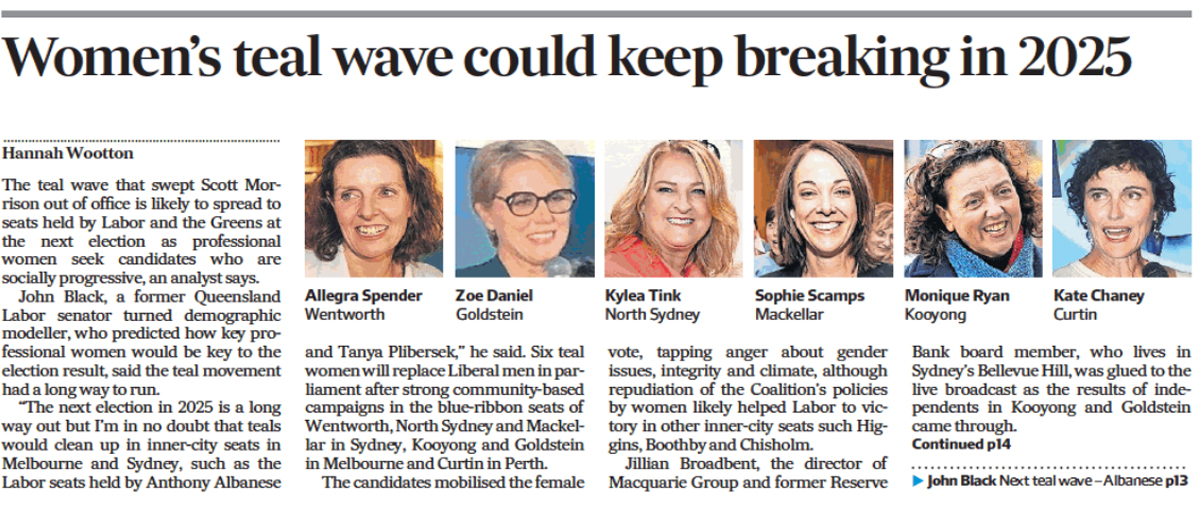
Women’s teal wave could keep breaking in 2025
by John Black – AFR – Editorial and Opinion

Womens Teal Vote Could Keep Breaking in 2025

 To Read click link
🔗 Financial Review, Monday, May 23, 2022, pages from 13 to 13.pdf

Image: AFR : https://www.afr.com


1 Day to Go – Election Profiles 2022

Friday 20th May,2022
Coalition Closing Gap On Labor
by John Black – AFR – Editorial and Opinion

Coalition closing gap on Labor by John Black

 To Read click link
🔗 Financial Review, Friday, May 20, 2022, pages from 39 to 39.pdf

Image: AFR : https://www.afr.com


2 Days to Go – Election Profiles 2022

Due to popular demand (my wife Jeanine thought it was a good idea), I’m re-posting the PDF I prepared a few months ago for my Australian Financial Review article of February 15 on the rise of the Teal vote and the associated decline of the primary vote for the major parties. It may help you on election night to understand why the major party primary votes have fallen, and also to  follow the larger swings to Labor in seats where popular Coalition members have retired, such as Bennelong or Casey.

Monday14th February, 2022
Political Voices: Past, Present & Future

 To Read click link
🔗 https://www.educationgeographics.net.au/political-voices-past-present-and-future/


3 days to Go – Election Profiles 2022

Wednesday 18th May,2022
How House Prices Reflect The Way You Vote
by John Black – AFR – Editorial and Opinion

How house prices reflect the way you vote by John Black

 To Read click link
🔗 Financial Review, Wednesday, May 18, 2022, pages from 14 to 14.pdf

Image: AFR : https://www.afr.com


5 Days to Go – Election Profiles 2022

Monday 16th May, 2022
🎙
John Black: Election Campaign Enters Final Sprint
episode from ABC “RN Breakfast” with Patricia Karvelas

To Listen click link
🔗https://www.abc.net.au/radionational/programs/breakfast/election-campaign-enters-final-sprint/13883250

Guest: John Black, former Labor Senator and Chief Executive of Australian Development Strategies

Image: ABC  RN : https://www.abc.net.au/radionational/programs/breakfast/


1 Week to Go – Election Profiles 2022

Friday 13th, May 2022
As tradies deserted ALP, so career women turn Liberal seats teal
by John Black – AFR – Editorial and Opinion

As tradies deserted ALP, so career women turn Liberal seats teal. Female professionals lead the demographic desertion in what use to be the safest Coalition electorates.

 To Read click link
🔗 Financial Review Friday May 13, 2022 Page 43 snip to PDF.pdf

Image: AFR : https://www.afr.com


3 Weeks to Go – Election Profiles 2022

Wednesday 4th May 2022
Inner Brissie could have gone teal
by John Black – AFR – Editorial and Opinion

Inner Brissie could have gone Teal

 To Read click link
🔗 Financial Review, Wednesday, May 4, 2022, pages from 46 to 46.pdf

Image: AFR : https://www.afr.com


3 Weeks to Go – Election Profiles 2022

Monday 2nd May, 2022
🎙
John Black: Labor on track for win
episode from ABC “RN Breakfast” with Patricia Karvelas

ABC RN To Listen click link
🔗https://www.abc.net.au/radionational/programs/breakfast/labor-on-track-for-election-win/13862818

Guest: John Black, former Labor Senator and Chief Executive of Australian Development Strategies

Image: ABC  RN : https://www.abc.net.au/radionational/programs/breakfast/


4 Weeks to Go – Election Profiles 2022

Thursday 21 April, 2022
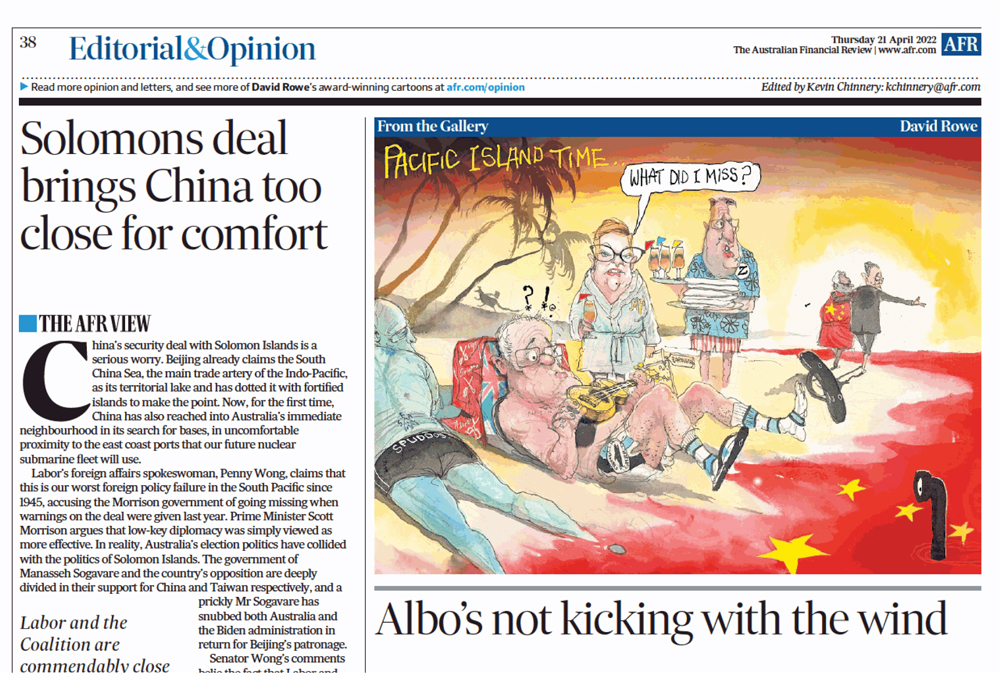
Albo’s not kicking with the wind
by John Black – AFR – Editorial and Opinion

Albo's not kicking with the wind. Despite the self-inflicted wounds, Labour remains in front in a majority of seats. But the margins are getting tighter.

 To Read click link
🔗 Financial Review, Thursday, April 21, 2022, pages from 38 to 38.pdf

Image: AFR : https://www.afr.com


3 Weeks to Go to Pre-Poll Voting

Tuesday 19th April, 2022

Australia Votes May 21, 2022 comments by John Black former Labor Senator Starts May 9, 2022, 12 days before voting day on May 21, 2022.
🔗 https://www.ecq.qld.gov.au/how-to-vote/how-to-cast-your-vote


4 Weeks to Go – Election Profiles 2022

Tuesday 19th April, 2022
🎙
John Black: Election still Labor’s to lose
episode from ABC “RN Breakfast” with Patricia Karvelas

ABC RN To Listen click link
🔗https://www.abc.net.au/radionational/programs/breakfast/john-black:-the-election-is-still-labors-to-lose/13844148

Guest: John Black, former Labor Senator and Chief Executive of Australian Development Strategies

Image: ABC  RN : https://www.abc.net.au/radionational/programs/breakfast/


6 Weeks to Go – Election Profiles 2022

Tuesday 13th April, 2022
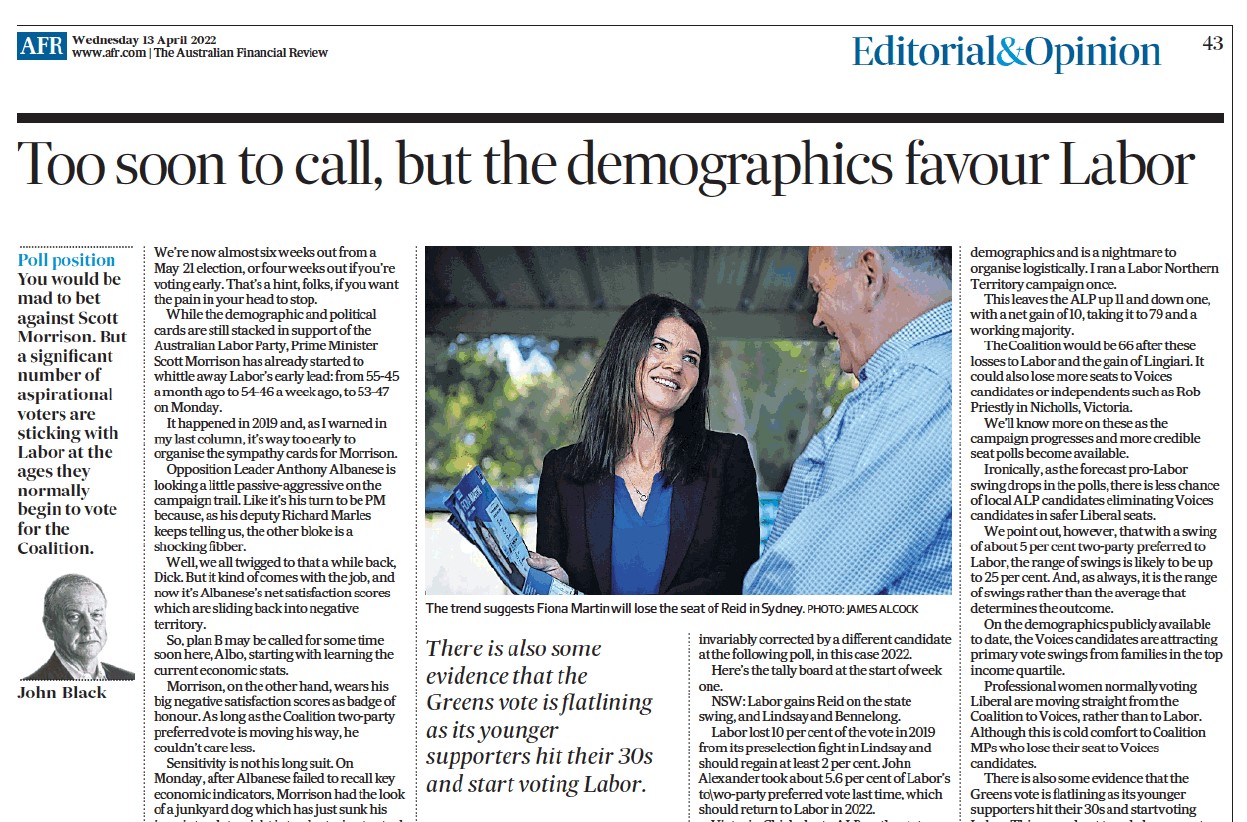
Too soon to call, but the demographics favour labor
by John Black – AFR – Editorial and Opinion

Too soon to call, but the demographics favour labor

 To Read click link
🔗 Financial Review, Wednesday, April 13, 2022, pages from 43 to 43.pdf

Image: AFR : https://www.afr.com


6 Weeks to Go – Election Profiles 2022

Monday 11th April, 2022
🎙 “Are the published opinion polls correct?”
episode from ABC “RN Breakfast” withPatricia Karvelas

To Listen click link
🔗 https://www.abc.net.au/radionational/programs/breakfast/are-the-published-opinion-polls-correct/13835438 

Guest: 
John Black, former Labor Senator and Chief Executive of Australian Development Strategies

Available now through the ABC listen App – bit.ly/ABCradioApp

Image: ABC  RN : https://www.abc.net.au/radionational/programs/breakfast/


11 Weeks to Go – Election Profiles 2022

Tuesday 29th March, 2022
Don’t order the sympathy cards for Morrison just yet
by John Black – AFR – Editorial and Opinion

Don't order the sympathy cards for Morrison just yet

 To Read click link
🔗 Financial Review, Tuesday, March 29, 2022, pages from 39 to 39.pdf

Image: AFR : https://www.afr.com


14 Weeks to Go – Election Profiles 2022

Tuesday 15th February, 2022
Women To Deliver Shock Election
by John Black – AFR – Editorial and Opinion

Women to deliver election shocks

 To Read click link
🔗 Financial Review, Tuesday, February 15, 2022, pages from 36 to 37.pdf

Image: AFR : https://www.afr.com


14 Weeks to Go – Election Profiles 2022

Monday14th February, 2022
Political Voices: Past, Present & Future

 To Read click link
🔗 https://www.educationgeographics.net.au/political-voices-past-present-and-future/


  • -
Key Swing Indicator Map for 2022 Federal Election

Key Swing Indicator Map for 2022 Federal Election

Category:Election Profiles,National 2022Tags : 

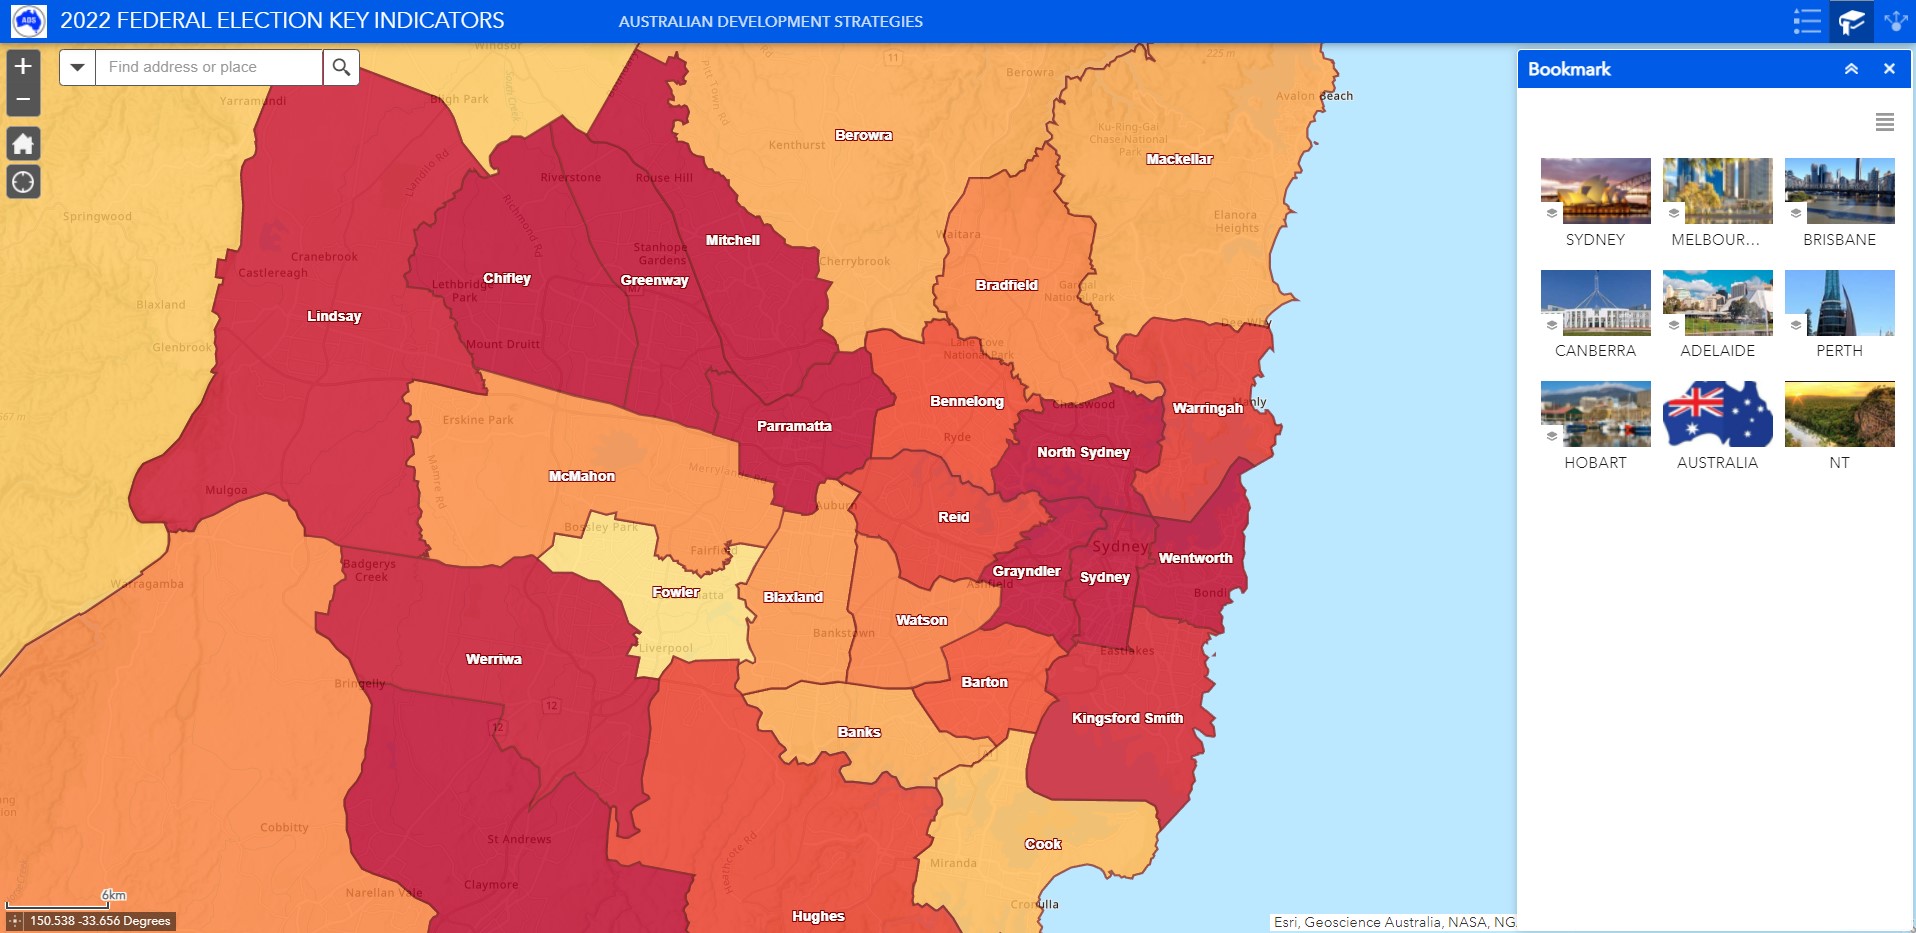
If you want to know which federal seats were more likely to show swings to the Opposition at the start of this election campaign, then the Esri map in this link isn’t a bad place to start. 

Link 🔗  2022 FEDERAL ELECTION KEY INDICATORS (arcgis.com)

Key Swing Indicator Map for 2022 Federal Election

The online Esri map uses the latest Australian Electoral Commission data on age groups for men and women by current federal seats and draws on 50 years of election profiling of Federal and State elections.  

When you open the Esri map, click on the three dots at top right to see the legend and then on the bookmark icon to zip between capital cities and territories. The map works on mobile phones and PCs.

The dark maroon electorates are those containing a mix of age groups covering maturing traditional swinging voters and aspirational voters in the ages at which they traditionally begin to move their vote from Labor to the Coalition. 

We see strong clusters of these seats containing high proportions of persons aged 35 to 49 years in Sydney, Melbourne, Brisbane and Perth. They cover a range of political allegiances, from traditionally safe Liberal to strong Labor.

With 2PP swings to the ALP of about five percent in the first week of the campaign, we would expect to see a range of swings of up to 25 percent, with plus five percent for Labor being the mid-point.

Of course, the figures will change during the campaign and other demographic indicators will emerge to pull some seats to swing to the Coalition. We will map these during the coming weeks.

This election I’m writing some research articles for the Australian Financial Review and doing Monday morning interviews with Radio National on election modelling for the May 21, 2022 election.

Catch you on the campaign trail, folks.  


  • -

Political Voices: Past, Present and Future

Category:Election Profiles,National 2022Tags : 

Profiling of the Voices 2019 demographics by Australian Development Strategies shows that grassroots campaigns by Voices candidates against Liberals in 2022 – led by professional women – could be even more devastating for Labor MPs if turned against them in 2025.

This means that the Federal election of 2022 is not so much a contest between the Liberal Party and the Labor Party, but more a contest about what future Labor and Liberal Governments will look like.

In the mid-1980’s, male Tradespersons was the biggest single male or female occupation group in Australia and Tradies dominated the ALP voting profile, and Female Professionals played an equally important role for the Liberal voting profile.

But both major parties have been challenged in 2022 by the loss of their historical bases of primary vote support during the past 40 years, among Tradies and Miners for Labor, and among Professionals for the Liberals.

The problem for both major parties is that, by November 2021, Female Professionals was the biggest single male or female occupation group in Australia and there were twice as many Professional Persons as Tradespersons, Clerks or Service Workers. And their vote is up for grabs.

I chart the demographics underling the decline in the attached
🔗 PDF – Political Voices Past, Present and Future

Political Voices Past, Present and Future by John Black, Australian Development Strategies

Coalition candidates in 2022 are vulnerable to well-funded and more professionally-managed “Voices” campaigns run by local activists, particularly when factionalised party machines select a favourite candidate with a negative personal vote, as this gives a leg-up to a Voices campaign.

Australian Development Strategies Modelling of booth-level profiles in a selection of Urban and Rural 2019 seats won or strongly contested by Independent or Green candidates, shows Voices candidates attracted support from some fast-growing demographics, including Agnostics and better-educated, professional women.

Economic trends infer the current demographic base of Voices candidates is likely to grow over time and, with a Labor win likely in 2022, this base could prove a bigger threat to Labor in 2025 than it is to the Liberals in 2022

Our ADS Senior Mapper Dr Jeanine McMullan has a 🔗Map showing the potential impact of Voices candidates in 2022.

The computed predicted Voices 2CP votes for Sydney (left) and Melbourne (right

The computed predicted Voices 2CP votes for Sydney (left) and Melbourne (right)


  • -
Election Analysis 2019 - Esri Map - ADS

ELECTION ANALYSIS 2019

Category:National 2019Tags : 

Here’s a fantastic Esri map done by Australian Development Strategies and Education Geographics Senior Mapper Dr Jeanine McMullan. It’s online, completely interactive, public and you can email it to your fellow election tragics. You can blow it up, reduce it, drag it around or select an address and see how it rated on each layer. Open it up at the link below, and then click on the little button in the top right corner of the page, to get some tips on how t o use it.

Among the other buttons at top right of the map, there are, from left, layers Layer - icon on Esri Map for all the key variables which decided who won the 2019 election, there’s bookmarks Bookmark icon Esri map for the major regions, so you can go there directly, there’s a score sheet of key indicators Score sheet indicator - icon Esri map toolbar under every screen being viewed with standardised scores (move the map around and watch the numbers update), there’s the info button , a share button Info - icon on Esri map toolbar so you can post the map to social media, a seat button Choose a seat icon on Esri Map Toolbar , so you can check out the scores for each individual seat and finally the legend for each layer displayed. Hours of fun from our mapper.

The link is https://egs-au.maps.arcgis.com/apps/webappviewer/index.html?id=1a84d2f75fe04666a7501c5cd7921c0f


  • -
Labor Digs a Hole with Miners - Federal Election 2019

LABOR DIGS A HOLE WITH MINERS

Category:National 2019Tags : 

Hello again, political tragics. As we proceed with our 2019 profiling, the longer-term damage Labor has done to itself with working class men just keeps getting uglier.

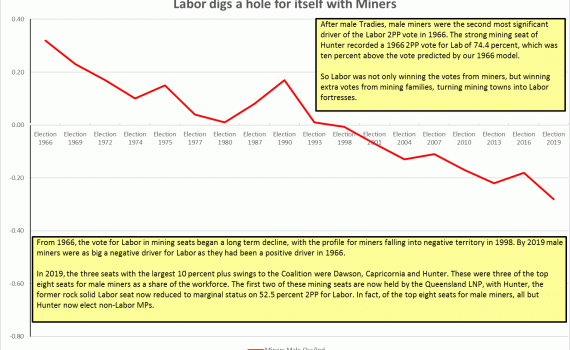
The chart here tracks the declining profile of miners for the ALP since we first profiled national elections back in 1966.

Labor Digs a Hole with Miners - Federal Election 2019

In 1966 the Labor Party and Labour Movement were the same group in strong mining seats, such as Hunter, held by Labor MPs since 1910.

After male Tradies, male miners were the second most significant driver of the Labor 2PP vote in 1966. The strong mining seat of Hunter recorded a 1966 2PP vote for Labor of 74.4 percent, which was ten percent above the vote predicted by our 1966 model.

So Labor was not only winning the votes from miners, but winning extra votes from mining families, turning mining towns and cities like Newcastle and Broken Hill into Labor fortresses. If you worked in the mines, you were in the union and if you were in the union, you voted Labor and so did your family and your neighbours.

From 1966, the vote for Labor in mining seats began a long-term decline, with the profile for miners falling into negative territory in 1998. By 2019 male miners were as big a negative driver for Labor as they had been a positive driver in 1966. In other words, you were more likely to find miners in Coalition seats than Labor seats and the stats were significant to more than 99.9 percent confidence levels.

In 2019, the three seats with the largest 10 percent plus swings to the Coalition were Dawson, Capricornia and the above seat of Hunter, three of the top eight seats for male miners as a share of the male workforce.

The first two of these mining seats – Dawson and Capricornia – are now held by the Queensland LNP, with Hunter, the former rock-solid Labor seat now reduced to marginal status on 52.5 percent 2PP for Labor.

In fact, of the top eight seats for male miners, all but Hunter now elect non-Labor MPs.

To add insult to injury, when we were modelling the swings to the Coalition across these three mining seats, not only did they record ten percent plus swings to the Coalition, but these swings averaged five percent greater in each seat than the national swing model was predicting.

So miners are voting for the Coalition, so are their families and their neighbours. The model from 1966 has been turned completely on its head.

The mining fortress for Labor among working class men in the mines has fallen. Rebuilding it seems a task too far for the Labor party by 2022, if it remains fixated on fighting back the Green challenge to its MPs in its inner urban Green Left seats. The miners don’t want to pay for them anymore.

To quote Labor’s great Finance Minister from the Hawke Government WA Senator Peter Walsh: if you base your policy on the demands of a minor party, you are destined to become one.


  • -
Shifting Demographic Tectonics - National Election 2019

SHIFTING DEMOGRAPHIC TECTONICS

Category:National 2019Tags : 

Hi again, election tragics. We’re currently sifting through the statistical entrails of Saturday’s election, looking for key demographic characteristics of the ALP and Coalition votes and swings.

Peeling back the layers to find the underlying linkages between demographics and votes is time consuming and we’re also a bit busy working in the real world at the moment, running Education Geographics.

To keep you entertained, while we rummage around columns of stats, here’s a cute little Excel file which shows correlations going back to the election in 1966 for some key occupational indicators, male Tradies, female Clerks and Professional women.

Shifting Demographic Tectonics - Federal Election 2019

Female clerks and male Tradies have traditionally been huge groups in the workforce, and they still dominate our Working Family Stereotype across urban marginal seats, but the proportion of Working Families in the labour market has been steadily eroded over recent decades by technological change, now known as digital disruption. Meanwhile, the workplace share of female Professionals is still growing fast and has already overtaken female Clerks, but these professionals are more clustered in the inner-cities and now dominate our Goat Cheese Circle Stereotype.

As Labor’s profile among Tradies declined during the 1980s, it increased among white collar working women, firstly among Clerks, then among Professionals, retaining a broad basis of support for Labor candidates across a majority of seats, while nudging it towards the inner cities, until Kevin Rudd’s Religious Activist profile in 2007 lifted Labor’s votes in the outer suburbs of our major capitals.

This professional support for Labor was lost in 2016, when Malcolm Turnbull led the Liberals, attracting inner urban professionals but at the expense of suburban Working Families. In 2019, under the folksy Scott Morrison as Liberal Leader, professional women turned back to Labor in droves, especially in Goat Cheese Circle seats. While this strategy held up Labor’s vote in higher SES seats, it didn’t work out quite so well with Labor’s traditional Working Families, especially in LNP seats in Queensland.

To sum up: It’s always good for a Party to win a majority of the 2PP national vote, but it’s even better to win a majority of seats. In 2019, Scott Morrison won both by attracting support from marginal seats containing traditional Labor heartland voters and skipping the Goat Cheese Circle set.

As Morrison would say: How good is that?